
The balance sheet, also called the statement of financial position, is the third general purpose financial statement prepared during the accounting cycle. It reports a company’s assets, liabilities, and equity at a single moment in time. You can think of it like a snapshot of what the business looked like on that day in time.
Unlike the income statement, the balance sheet does not report activities over a period of time. The balance sheet is essentially a picture a company’s recourses, debts, and ownership on a given day. This is why the balance sheet is sometimes considered less reliable or less telling of a company’s current financial performance than a profit and loss statement. Annual income statements look at performance over the course of 12 months, where as, the statement of financial position only focuses on the financial position of one day.
The balance sheet is basically a report version of the accounting equation also called the balance sheet equation where assets always equation liabilities plus shareholder’s equity.
In this way, the balance sheet shows how the resources controlled by the business (assets) are financed by debt (liabilities) or shareholder investments (equity). Investors and creditors generally look at the statement of financial position for insight as to how efficiently a company can use its resources and how effectively it can finance them.
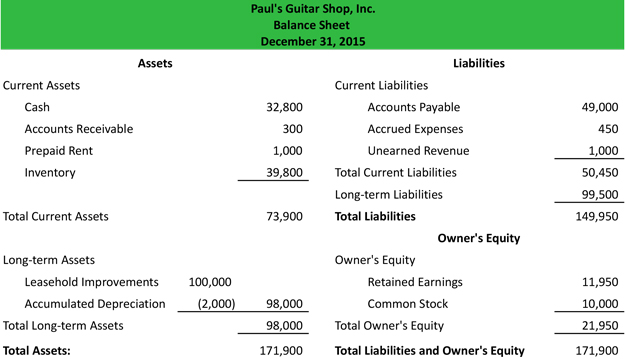
This statement can be reported in two different formats: account form and report form. The account form consists of two columns displaying assets on the left column of the report and liabilities and equity on the right column. You can think of this like debits and credits. The debit accounts are displayed on the left and credit accounts are on the right.
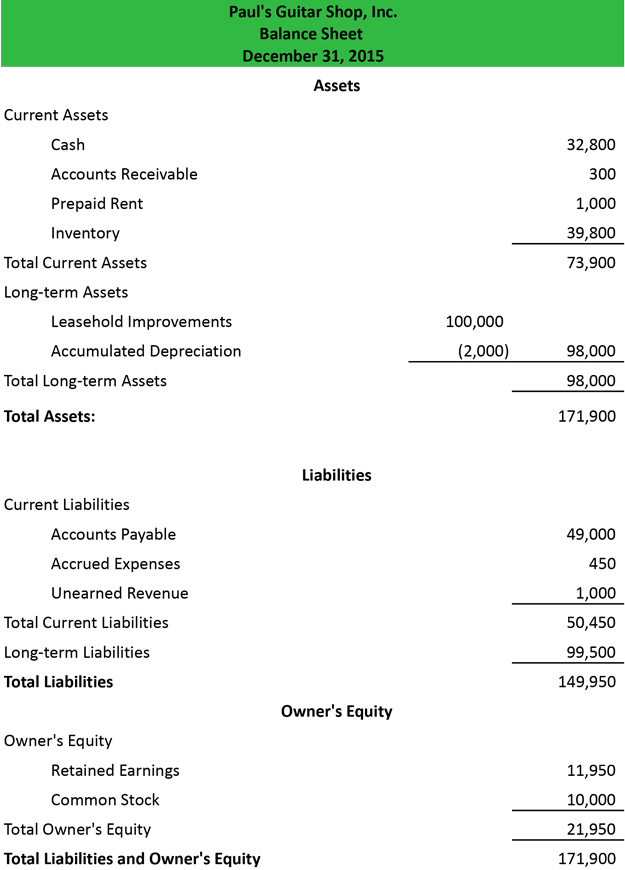
The report form, on the other hand, only has one column. This form is more of a traditional report that is issued by companies. Assets are always present first followed by liabilities and equity.
In both formats, assets are categorized into current and long-term assets. Current assets consist of resources that will be used in the current year, while long-term assets are resources lasting longer than one year.
Liabilities are also separated into current and long-term categories.
Let’s look at each of the balance sheet accounts and how they are reported.
Similar to the accounting equation, assets are always listed first. The asset section is organized from current to non-current and broken down into two or three subcategories. This structure helps investors and creditors see what assets the company is investing in, being sold, and remain unchanged. It also helps with financial ratio analysis. Ratios like the current ratio are used to identify how leveraged a company is based on its current resources and current obligations.
The first subcategory lists the current assets in order of their liquidity. Here’s a list of the most common accounts in the current section:
The second subcategory lists the long-term assets. This section is slightly different than the current section because many long-term assets are depreciated over time. Thus, the assets are typically listed with a total accumulated depreciation amount subtracted from them. Here’s a list of the most common long-term accounts in this section:
Many times there will be a third subcategory for investments, intangible assets, and or property that doesn’t fit into the first two. Here are some examples of these balance sheet items:
According to the historical cost principle, all assets, with the exception of some intangible assets, are reported on the balance sheet at their purchase price. In other words, they are listed on the report for the same amount of money the company paid for them. This typically creates a discrepancy between what is listed on the report and the true fair market value of the resources. For instance, a building that was purchased in 1975 for $20,000 could be worth $1,000,000 today, but it will only be listed for $20,000. This is consistent with the balance sheet definition that states the report should record actual events rather than speculative numbers.
Liabilities are also reported in multiple subcategories. There are typically two or three different liability subcategories in the liabilities section: current, long-term, and owner debt.
The current liabilities section is always reported first and includes debt and other obligations that will become due in the current period. This usually includes trade debt and short-term loans, but it can also include the portion of long-term loans that are due in the current period. The current debts are always listed by due dates starting with accounts payable. Here’s a list of the most common current liabilities in order of how they appear:
The second liabilities section lists the obligations that will become due in more than one year. Often times all of the long-term debt is simply grouped into one general listing, but it can be listed in detail. Here are some examples:
A lot of times owners loan money to their companies instead of taking out a traditional bank loan. Investors and creditors want to see this type of debt differentiated from traditional debt that’s owed to third parties, so a third section is often added for owner’s debt. This simply lists the amount due to shareholders or officers of the company.
Unlike the asset and liability sections, the equity section changes depending on the type of entity. For example, corporations list the common stock, preferred stock, retained earnings, and treasury stock. Partnerships list the members’ capital and sole proprietorships list the owner’s capital.
Like all financial statements, the balance sheet has a heading that display’s the company name, title of the statement and the time period of the report. For example, an annual income statement issued by Paul’s Guitar Shop, Inc. would have the following heading:
Here is an example of how to prepare the balance sheet from our unadjusted trial balance and financial statements used in the accounting cycle examples for Paul’s Guitar Shop.


As you can see, the report format is a little bit easier to read and understand. That is why most issued reports are presented in report form. Plus, this report form fits better on a standard sized piece of paper.
One thing to note is that just like in the accounting equation, total assets equals total liabilities and equity. This is always the case. If you are preparing a balance sheet for one of your accounting homework problems and it doesn’t balance, something was input incorrectly. You’ll have to go back through the trial balance and T-accounts to find the error.
Now that the balance sheet is prepared and the beginning and ending cash balances are calculated, the statement of cash flows can be prepared.
Now that you can answer the question what is a balance sheet. Let’s look at how to read a balance sheet. Investors, creditors, and internal management use the balance sheet to evaluate how the company is growing, financing its operations, and distributing to its owners. A single sheet won’t tell you that much about the company, but a comparative report that shows two to three years of trend will tell you how cash is being spent, the amount of debt being paid off, and the level of investments being made each year. It will also show the if the company is funding its operations with profits or debt.
Accounting & CPA Exam Expert
Shaun Conrad is a Certified Public Accountant and CPA exam expert with a passion for teaching. After almost a decade of experience in public accounting, he created MyAccountingCourse.com to help people learn accounting & finance, pass the CPA exam, and start their career.